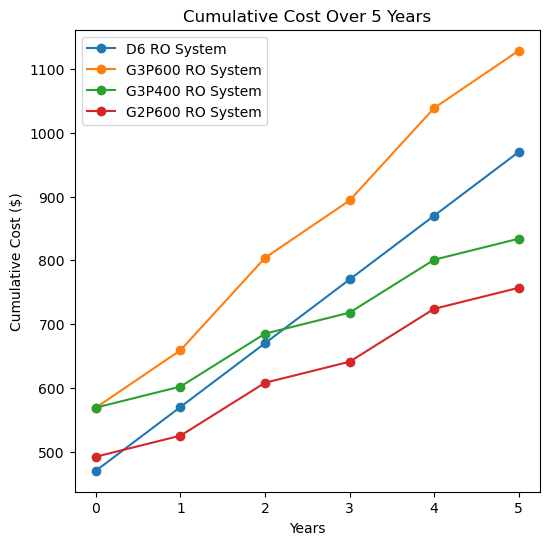
Quick cost calculation of tankless RO systems
Published:
Plan to buy an RO system with Waterdrop. Check out available models here
import matplotlib.pyplot as plt
import numpy as np

# Constants and input data
years = 5
initial_cost_D6 = 470
cartridge_cost_D6 = 99.99  # Annual cost

# G3P600 RO system cartridge costs and replacement intervals
cartridge_costs_G3P600 = [29.99, 109.99, 29.99]  # Costs of different cartridges
cartridge_lifetimes_G3P600 = [0.5, 2, 1]  # Lifetimes in years for each cartridge
initial_cost_G3P600 = 569

# G3P800 RO system cartridge costs and replacement intervals
cartridge_costs_G2P600 = [32.99, 99.99]  # Costs of different cartridges
cartridge_lifetimes_G2P600 = [1, 2]  # Lifetimes in years for each cartridge
initial_cost_G2P600 = 492

# G3P400 RO system cartridge costs and replacement intervals
cartridge_costs_G3P400 = [29.99, 92.99 , 29.99]  # Costs of different cartridges
cartridge_lifetimes_G3P400 = [0.5, 2 , 1]  # Lifetimes in years for each cartridge
initial_cost_G3P400 = 569


# Calculate cumulative costs over 10 years
cumulative_cost_D6 = [initial_cost_D6 + cartridge_cost_D6 * year for year in range(years + 1)]
cumulative_cost_G3P600 = [initial_cost_G3P600]

for year in range(1, years + 1):
    annual_cost = sum([cost / lifetime if year % lifetime == 0 else 0
                       for cost, lifetime in zip(cartridge_costs_G3P600, cartridge_lifetimes_G3P600)])
    cumulative_cost_G3P600.append(cumulative_cost_G3P600[-1] + annual_cost)

cumulative_cost_G2P600 = [initial_cost_G2P600]
for year in range(1, years + 1):
    annual_cost = sum([cost / lifetime if year % lifetime == 0 else 0
                       for cost, lifetime in zip(cartridge_costs_G2P600, cartridge_lifetimes_G2P600)])
    cumulative_cost_G2P600.append(cumulative_cost_G2P600[-1] + annual_cost)

cumulative_cost_G3P400 = [initial_cost_G3P400]
for year in range(1, years + 1):
    annual_cost = sum([cost / lifetime if year % lifetime == 0 else 0
                       for cost, lifetime in zip(cartridge_costs_G2P600, cartridge_lifetimes_G2P600)])
    cumulative_cost_G3P400.append(cumulative_cost_G3P400[-1] + annual_cost)

plt.figure(figsize=(6, 6))
# plt.subplot(1, 2, 1)
plt.plot(range(years + 1), cumulative_cost_D6, label='D6 RO System', marker='o')
plt.plot(range(years + 1), cumulative_cost_G3P600, label='G3P600 RO System', marker='o')
plt.plot(range(years + 1), cumulative_cost_G3P400, label='G3P400 RO System', marker='o')
plt.plot(range(years + 1), cumulative_cost_G2P600, label='G2P600 RO System', marker='o')
plt.title("Cumulative Cost Over 5 Years")
plt.xlabel("Years")
plt.ylabel("Cumulative Cost ($)")
plt.legend()
plt.show()

